41st Annual Contact Lens ReportFollow the links below to read the other articles from our 41st annual Contact Lens Report: |
Corneal topography is exceptionably useful for examining characteristics of the cornea such as shape, curvature, power and thickness. It is also an essential tool for the contact lens specialist.
Over the past 150 years, the use of corneal topography has expanded from mapping of the cornea’s curvature to evaluation of several specific corneal and ocular surface characteristics. Clinicians can use it to assess the ocular surface prior to contact lens fitting, observe how a contact lens alters the shape and quality of the cornea and tear film, and monitor the relationship between the eye and the contact lens during wear.1
The primary technologies used in modern corneal topography are placido disc, Scheimpflug and scanning-slit topography. Here is a review of the systems and how they can help you better fit, monitor and manage contact lens patients.
 |
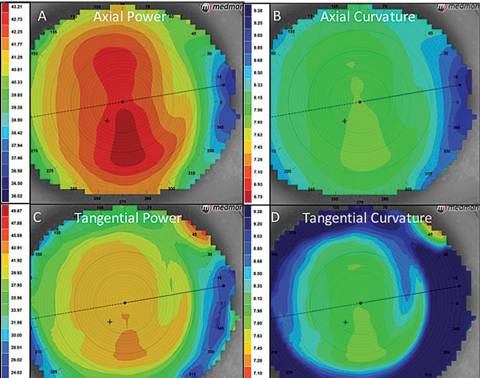
| Fig. 1. Above are the four basic power maps of corneal topography. ODs can view the axial map (A, B) and tangential map (C, D) as power or curvature. |
Placido Disc Topography
After projecting a concentric annular light source onto the corneal surface, placido disc reflection systems capture the reflected light so their software can measure curvature, irregularities, foreign bodies, tear film nuances and other characteristics of the anterior cornea. These systems are highly dependent on the tear film, which is the part of the ocular surface that is actually reflecting light. This allows for a noninvasive measure of tear film quality, but it can also hinder accuracy when measuring corneal power and shape.
Placido disc systems can be categorized as either small-cone or large-cone systems. Small cones collect more data points and are ultimately more accurate, but large cones are easier to manipulate and data collection can be easier. Some examples of small-cone placido disc systems include the E300 (Medmont), Keratron (Optikon), Keratron Scout (Optikon) and Keratron Piccolo (Optikon), while large-cone system examples include the Keratograph (Oculus), Atlas (Zeiss) and ReSeeVit (Veatch Ophthalmic Instruments).
 |
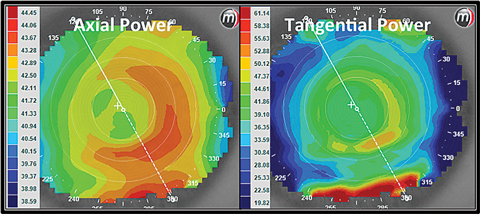
| Fig. 2. These axial and tangential power maps show an eye wearing a +2.50 center distance soft multifocal lens design. Click image to enlarge. |
Scheimpflug and Scanning-Slit Topography
The primary difference in output data from a placido disc system when compared with a Scheimpflug or scanning-slit topography system is that the latter two provide information about the posterior cornea. Rotating Scheimpflug cameras, such as the Pentacam (Oculus), use off-axis light to capture precise measurements of the anterior and posterior surfaces of the cornea, allowing the system to calculate global pachymetry and allow characteristics such as corneal swelling to be monitored during contact lens wear.2 Scanning-slit topographers, such as the Orbscan (Bausch + Lomb), project two vertical scans through 40 optical slits at fixed angles to analyze the curvatures at the anterior and posterior corneal surface, also allowing the system to gather posterior data, including thickness.
 |
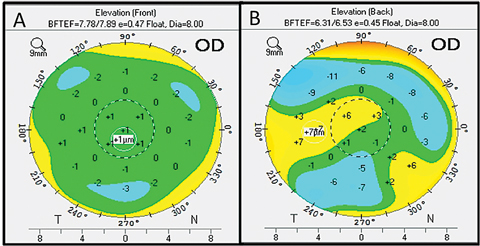
| Fig. 3. Here is an example of an elevation map from the Pentacam. Click image to enlarge. |
Contact Lens Management
Corneal topographers collect tens of thousands of data points from the corneal surface. From these data points, power, shape and other characteristics of the cornea can be calculated. Display options for this information depend on what information is needed, which makes a thorough understanding of the different corneal topography map types important. While there are dozens of different display options in the various topography instruments, the following are the most applicable to contact lens care.
Axial Display Map
The most traditional way to view a topography image is with the axial display map (Figure 1). One positive of this map is that it is the best way to get a quick overview of the corneal power. It can be also misleading, however, because it averages the data to create a “smooth” map, making it less accurate than other power maps (i.e., tangential). Central data is more accurate than peripheral data on the axial map because the averaging algorithms in the software assume a spherical surface and the cornea becomes more aspheric in the periphery. Depending on which area of the cornea is being evaluated, the averaging feature of the axial map could be a major limitation. For example, if central data is of greatest importance, then the map will be relatively accurate, but if a specific power map of the periphery is guiding a choice about a contact lens fit, the map may not provide the accuracy you need.
Axial maps are ideal for base curve selection of a corneal or soft contact lens because the average of the central curvature is portrayed. For specific information about the corneal shape and power, other displays will be more helpful.
Tangential Display Map
The most sensitive of the power maps are tangential display maps, and as such, they measure power and curvature at individual points on the cornea the most accurately. Often, a lens fitter must be aware of the precise changes to the corneal curvature when making clinical decisions. Some indications of corneal topography will benefit from use of the tangential map display more than others. For example, tangential maps may be beneficial in orthokeratology (ortho-k), especially when evaluating the shape of the peripheral cornea, as this display provides the most accurate peripheral data.3
Additionally, evaluating a contact lens power while it is on the eye can be done using the tangential display map, especially when a patient is wearing a multifocal lens and the positioning of the optics is important (Figure 2). The display will show the power of the contact lens over the cornea, so that an examiner can accurately observe the positioning of the lens optics or to get a better clinical picture of what optics are on the surface of the eye when the patient is wearing a contact lens. The tangential display is also the most sensitive to changes in corneal curvature caused by distortion or warpage of the cornea from contact lens wear.
Elevation Display Map
The go-to option for conveying the true shape of the cornea is the elevation display map. It is important to note that placido disc systems use complicated algorithms to calculate the corneal elevation, while Scheimpflug systems measure the elevation directly, so the latter system may give the most accurate data.4 Regardless, both systems output elevation in reference to a “best-fit sphere,” which is calculated and extrapolated through the cornea. The systems then calculate areas of relative elevation or depression based on the deviation from the best-fit sphere, and the deviation values are displayed in microns (Figure 3). In placido disc systems, only the anterior surface is measured, while Scheimpflug systems measure both the anterior and posterior elevations. Clinically, both technologies are adequate for contact-lens-related use.
This elevation display map is important when first determining the best lens design to fit on an irregular cornea, specifically when deciding between a corneal or scleral gas permeable (GP) lens. Corneal GP lenses rest on the corneal surface, so the anterior shape of the cornea is important in predicting their success. The elevation display map shows the shape of the anterior surface, which is important because as the irregularities of the cornea become greater, the surface is less likely to be symmetric, making it difficult to fit a mostly symmetrical lens on top of the surface.
Based upon clinical experience, a difference in corneal elevation greater than approximately 325µm (between the highest peak and lowest point of elevation) will lead to limited success with corneal GP fit stability. GP lenses fit onto a cornea with these levels of elevation difference will rock on the eye, fall out of place intermittently and often cause discomfort and visual instability in wearers.
Individuals with this amount of elevation variation will likely need a scleral lens, which is less sensitive to corneal elevation differences because they vault the cornea.
The elevation display map is also useful in ortho-k management. Evaluating this map at baseline will allow practitioners to determine if the corneal shape is regular enough to support an ortho-k lens. More specifically, it will help them decide whether to use a dual-axis or single-axis lens. A patient with astigmatism will have differences in elevation between the two major meridians. If this difference in elevation is greater than about 15µm between the meridians, a dual-axis option will be needed to ensure the same depth remains evenly distanced from the cornea throughout the entire return zone. In ortho-k, this is essential to ensure even distribution of the displaced cells.
 |
| Fig. 4. This comparative display shows the corneal thickness displays of the same eye before (A) and after (B) initiating contact lens wear. The difference map (C) calculates the change in corneal thickness. Click image to enlarge. |
Corneal Thickness Display Map
Pachymetric capabilities are only available in Scheimpflug cameras and scanning-slit topographers, since these instruments measure posterior as well as anterior surface characteristics. This display can be used to stage diseases (i.e., keratoconus), but in active contact lens wear, the primary use of this display is to monitor corneal thickness changes due to contact lens-related hypoxia.
Evaluating corneal thickness changes during contact lens wear is important for scleral lens wearers, as they may be more prone to hypoxic complications. The corneal thickness display map is helpful for these patients (Figure 4).5-8
The corneal thickness display map can also be beneficial in ortho-k management, allowing practitioners to monitor corneal thickness changes as tissue is displaced from central to peripheral. This is a great supplement to the tangential and elevation displays and can be valuable when making determinations about lens fitting. When ortho-k lenses for myopia are worn, tissue is moved from the central cornea to the periphery. As a result, the central cornea will become thinner and the peripheral cornea thicker. The sensitive global pachymetry measurements can show if there is asymmetry in the movement of tissue centrally to peripherally.
Tear Break-up Display
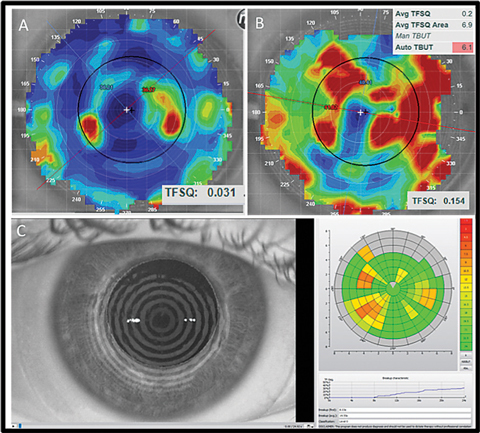
Among the most novel options on modern topography instruments for contact lens management are tear break-up displays (Figure 5).
Noninvasive tear break-up scores can be measured prior to initiating contact lens wear to gauge the quality of the natural tear film and see how it is affected by contact lens wear.9 A measurement is taken prior to lens wear and then compared to the subsequent measures to see how tear film quality is objectively affected in lens wearers with and without the lens in place.
Tear break-up displays can also be used when taking topography over the top of a contact lens. The surface wettability of the lens can be indirectly evaluated using this display, and a quantitative score will allow monitoring over wear time.
In addition, some instruments allow for video recording broken down by frames per second. This allows practitioners to dynamically evaluate changes in the tear film quality as patients blink.
 |
| Fig. 5. Here are a few examples of noninvasive tear breakup assessments. The top panel shows the tear film quality score display from an E300. The bottom panel is a similar assessment using the Keratograph. |
Additional Features
Beyond the various displays that can be applied to contact lens management, many modern topography systems have additional features that are applicable to contact lens care.
Contact lens fitting software allows practitioners to simulate a contact lens on the ocular surface and empirically order lenses that incorporate the entire shape of the cornea, including peripheral eccentricities, to provide a more customized contact lens fit. These programs have been shown to be effective at predicting the fit of a corneal keratoconus lens.10
Design-specific software, in which practitioners can upload topography images to simulate lens fits prior to ordering, is also available through lens manufacturers. These programs are most useful with corneal GP fitting, as the base curves of irregular corneas are not as predictive of scleral fitting.11
The OxiMap feature of the Keratograph calculates the Dk profile of specific contact lenses, and since the Dk is usually reported for powers of -3.00D only, this is useful information when practitioners want to know the specific Dk in all areas of the lens. This feature also aids practitioners in understanding the Dk profile of high-power lenses, or when fitting patients who are prone to hypoxic complications.
Many topography systems feature photography. These instruments are capable of snapping photographs of the iris and pupil behind the cornea in addition to the cornea. Practitioners can use these photographs to measure pupil size and centration. When fitting bifocal lenses for presbyopia and myopia control, this feature allows practitioners to match pupils to the optics of the lens, maximizing the understanding of optic placement for each individual. From this, practitioners can also calculate horizontal visible iris diameter and glean information about eyelid placement in relation to the cornea and pupil.
Meibography can be done using some topography systems to show changes in meibomian gland (MG) quality throughout contact lens wear. There is some evidence that the amount of MG atrophy may be greater in chronic contact lens wearers, and patients with MG atrophy may experience reduced comfort, so a system to monitor MG quality could help practitioners confirm a correlation.12-15 Meibography images also allow for subjective MG evaluation, and enhancements of the resulting images can reveal the location of tortuosity and atrophy.
Aberrometry can also be used on many topography systems to troubleshoot visual dissatisfaction with contact lenses. If a patient has non-specific visual complaints, taking these measurements with and without contact lenses in place can help determine which modality is most appropriate. If an excess amount of aberration exists prior to contact lens wear, the patient will be best suited for a rigid modality. Aberrometry taken over a contact lens will show how well a lens is able to correct higher-order aberrations.
Corneal topography is an established and important technology for measuring the shape and power of the cornea. It allows practitioners not only to fit contact lenses to match the power and shape of the cornea, but it also helps them to evaluate intricacies of the contact lens relationship with the ocular surface. As these systems continue to develop modules to better evaluate corneal surfaces and tear film, practitioners can provide more specific and advanced management to their contact lens patients.
Dr. Walker is an attending clinician at University of Houston College of Optometry.
1. Nichols JJ, Sinnott LT. Tear film, contact lens, and patient-related factors associated with contact lens-related dry eye. Invest Ophthalmol Vis Sci. 2006;47(4):1319-28. |

