Clinical applications for optical coherence tomography (OCT) have expanded exponentially since its commercial introduction approximately 15 years ago. OCT measurements are increasingly used as clinical endpoints and for monitoring various ocular disorders. Numerous clinical studies, including large, multi-centered, prospective clinical trials, are employing OCT findings as study endpoints.1-2
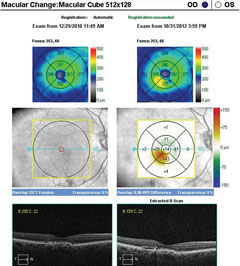 |
| SD-OCT macular change analysis demonstrating the development of DME over a period of less than four months. Click image to enlarge. |
Clinicians are now using OCT in clinical practice for both anterior and posterior segment pathologies, as it provides valuable data that can aid in the detection of ocular pathologies, as well as track progression of the condition and the response to treatment. For example, OCT can help detect optic neuropathies with retinal nerve fiber layer (RNFL) loss, such as in glaucomatous damage. The instrument can also be used to identify disc edema and even buried disc drusen. Analysis of retinal thickness over the macula and posterior pole can help detect retinal edema or atrophy. The retinal pigment epithelium (RPE) and choroid can also be better visualized with new imaging modalities such as enhanced-depth imaging (EDI). Anterior segment OCT can provide further insight into anterior chamber depth, angle anatomy and corneal pathologies.
OCT is an important diagnostic tool, yet is currently not considered the standard of care for evaluating the retina and is not required to diagnose glaucoma. There is also no publication in peer-reviewed literature that has definitively proven that OCT can serve as a surrogate for functional vision tests such as visual acuity and visual fields. However, large, multi-centered clinical studies have used OCT in the assessment of macular thickness, and there is extensive literature demonstrating that RNFL and ganglion cell analyses are valuable in the diagnosis and management of glaucoma.
Without any specific guidelines, clinicians vary on the use of OCT within their practice. The underuse of the instrument can lead to misdiagnosis of visually threatening conditions, while overuse can result in a financial burden to the health care system. This article discusses the role of OCT in clinical practice and looks at the literature for evidence to support its value and limitations. Common ocular pathologies such as age-related macular degeneration (AMD), diabetic macular edema (DME) and glaucoma will be discussed as examples of OCT’s use in clinical practice.
OCT in AMD ManagementNeovascular AMD
Non-neovascular AMD
Limitations
|
Age-related Macular Degeneration
An estimated 80% of AMD patients have non-neovascular, or “dry,” AMD. The remaining 20% have neovascular, or “wet,” AMD, which accounts for nearly 90% of the severe central visual acuity loss associated with AMD.3-5 Early detection of neovascular AMD is crucial to prevent permanent vision loss secondary to subretinal fibrosis.6 Previous clinical studies emphasize the importance of fluorescein angiography (FA) patterns in neovascular AMD to guide appropriate treatment.7,8 Specifically, the ideal treatment choice was dictated by differentiating between choroidal neovascular (CNV) membranes that exhibited classic vs. occult appearance as the type of membrane.7,8 However, now that anti-vascular endothelial growth factor (VEGF) agents are preferred for treating patients with all types of neovascular AMD, the CNV lesion type is no longer important.9-10The detection of subtle subretinal fluid in early stages of choroidal neovascularization from neovascular AMD can be difficult to identify on biomicroscopy; however, OCT has proven to be valuable in diagnosing and managing neovascular AMD, as choroidal neovascularization is visible on OCT.1,11-13 The instrument can identify areas of retinal thickening and track thickness changes. Automated change analysis allows clinicians to compare scans to detect subtle retinal thickening that may have been missed on clinical examination. In one study, fluid detected on OCT, along with the presence of leakage on FA, was used to define active CNV.1 Foveal thickness determined by the OCT was also a secondary outcome and was used to guide when retreatment was indicated.1
The widespread use of OCT has minimized the role FA plays in AMD diagnosis and treatment, as many retinal specialists are now using OCT, especially SD-OCT, instead of FA as a guide when considering further anti-VEGF treatment. The updated 2015 AMD Preferred Practice Pattern guidelines (PPP) from the American Academy of Ophthalmology (AAO) notes that OCT is important in the diagnosis and management of AMD.5
OCT is especially helpful in detecting early CNV in patients with new complaints of metamorphopsia or unexplained blurred vision.5 However, systematic review of studies from 1995 to March 2013 revealed that, although time-domain (TD) OCT is a relatively sensitive test for the initial diagnosis of neovascular AMD, it is of moderate specificity.14,15 The review suggested that TD-OCT should not replace FA in the diagnosis of neovascular AMD and that further research is required to evaluate the diagnostic performance of SD-OCT, since there were limited studies in the literature comparing the instrument with FA.14,15
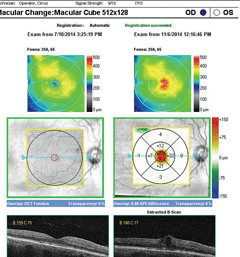 |
| SD-OCT macular change analysis demonstrating the development of DME over a period of less than four months. Click image to enlarge. |
In non-neovascular AMD, OCT has helped identify many features related to the degenerative process and expand our understanding of the condition. Reticular drusen, subretinal drusen deposits, pseudocysts, outer retinal tubulation and drusen-associated acquired vitelliform lesions are only a few of the non-neovascular AMD findings OCT can detect.16-18 Additionally, change analysis software available on various SD-OCT instruments can be helpful in identifying drusen enlargement or reabsorption. SD-OCT findings identified in association with non-neovascular AMD have also predicted drusen-associated chorioretinal atrophy. This can be important in patient management when predicting the risk and rate of vision loss.19
Diabetic Macular Edema
The Early Treatment Diabetic Retinopathy Study (ETDRS) emphasized the importance of treating clinically significant macular edema (CSME) to prevent vision loss. This landmark study used stereo contact lens biomicroscopy and stereo photography to define CSME, and FA was used to guide the photocoagulation treatment.20 Now, OCT is routinely used to evaluate DME in clinical practice. Large clinical trials evaluating the efficacy of anti-VEGF treatment, such as the RIDE and RISE studies, have incorporated OCT findings, along with a corresponding decrease in vision, in their definition of DME.21 In these studies, researchers used OCT, rather than stereoscopic photographs or clinical examination, because it allowed for an objective assessment and quantified the amount and location of retinal thickening.21-24OCT in DME Management
Limitations
|
In clinical practice, the decision to treat DME is usually based on OCT findings. Added to that, the instrument allows for tracking the response to treatment. The American Academy of Ophthalmology’s Preferred Practice Pattern for diabetic retinopathy recognizes the role of OCT in assessing DME, stating that OCT can be used to evaluate unexplained visual acuity loss, identify areas of vitreomacular traction and evaluate patients with difficult or questionable examinations for DME. The PPP does not recommend using OCT to screen a patient with no or minimal diabetic retinopathy.25 A baseline OCT could be obtained as a reference, but routine macular OCT scans are not recommended if there is no suspicion of DME on clinical examination.25,26 For patients with subclinical DME detected with OCT, close monitoring is recommended because of the increased risk for developing visually significant CSME. A four to six month follow up interval has been suggested based on the generally slow change in OCT values and delayed time to treatment.26-31
Glaucoma
Optic nerve head (ONH) evaluation in the management of glaucoma has been traditionally assessed by ophthalmoscopy and color stereo disc photography. Color stereo disc photographs of the optic nerve are still considered the standard for documenting the ONH status for glaucomatous optic neuropathy.32-35 Red-free photographs can be used to enhance the RNFL defects; however, these are limited by the subjectivity of the quantitative analysis and the dependence on the clinician.35,36
Studies have demonstrated measurement of ONH parameters by OCT can aid in the diagnosis of glaucoma.37 OCT imaging can also aid in distinguishing glaucomatous damage from eyes without glaucoma to help facilitate earlier diagnosis and detection of optic nerve damage.38
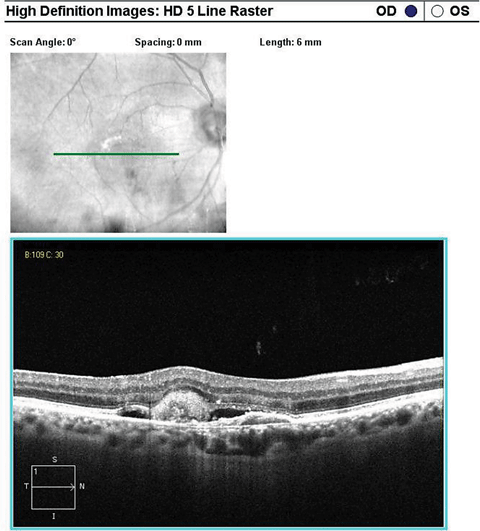 |
| SD-OCT high-definition 5-line raster scan inferior to the fovea over the CNV. Click image to enlarge. |
In addition to assessing the ONH, OCT imaging also allows for evaluation of the peripapillary RNFL (pRNFL). The instrument provides an objective measurement of the structural changes in RNFL thickness and ONH parameters occurring in glaucoma.38 ONH parameters provided by OCT can include optic disc area, optic disc rim area, average cup-to-disc ratio, vertical cup-to-disc ratio, and cup volume. Patients with early glaucomatous damage can demonstrate preperimetric glaucoma, leading to structural alterations in the ONH, pRNFL and macular areas before functional changes occur.37,38
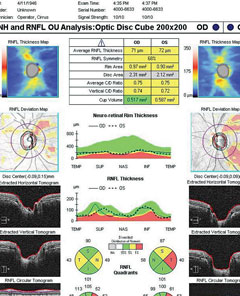 |
| SD-OCT ONH and RNFL analysis in a patient with early POAG. Right eye has movement with motion artifact superiorly. Both eyes have RNFL loss that is borderline or outside normal limits compared with the normative database. Click image to enlarge. |
Peripapillary RNFL thickness as measured by OCT has been extensively studied to distinguish glaucomatous damage and the severity of the disease. The instrument provides average RNFL thickness, which can further be divided into RNFL thickness measures in quadrants and sectors. This separation allows the analysis of RNFL loss into specific patterns that can help distinguish non-glaucomatous optic neuropathies.39,40
Recently, new software has allowed analysis of the macular region for detection of glaucomatous damage. Segmentation software specifically evaluating the ganglion cell layer, inner plexiform layer, RNFL over the macula or a combination of all three has emphasized that early glaucomatous damage can involve central vision. Studies on these specific layers in the macular region have identified that these parameters are as sensitive as pRNFL analysis in the detection of glaucoma.41-43 However, the analysis is limited to those patients without macular pathology, and only updated SD-OCT software versions have this capability.
The AAO PPP for primary open-angle glaucoma (POAG) suggests that computer-based image analysis of the ONH and RNFL, such as OCT, are complementary tests.34 One of the major limitations of OCT is the narrow range of the normative databases for each OCT manufacturer. Each manufacturer has a proprietary normative database that can range from 201 to 480 subjects. The ethnicities of the subjects included in the databases are generally not diverse. The normative data is also limited regarding the included age range and magnitude of refractive error.44-46 When analyzing the printout, clinicians must be cautious if the patient falls outside the normative database, as they may misinterpret the findings based on the colors of green or red that suggest normal or abnormal.46 In addition, scans between different OCT instruments cannot be used for comparison. For example, the pRNFL is measured by a collection of data points in a circle placed around the optic disc, and the diameter of the circle varies with each instrument.
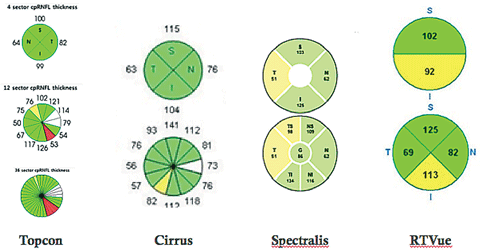 |
| Peripapillary retinal nerve fiber layer thickness of various SD-OCT instruments. |
Because glaucoma is a progressive optic neuropathy, reproducible data is important in longitudinal evaluation to track RNFL loss. To track progression, the OCT must have excellent repeatability. Detectable RNFL loss requires a change greater than that expected from usual testing variations.47,48 Most instruments have tracking software to recall the baseline scan location. Without active eye tracking technology, pRNFL thickness can vary significantly; thus, the OCT’s ability to track eye movement improves its reliability. However, clinicians are still faced with the challenge of interpreting true progressive RNFL loss from glaucoma, other optic neuropathies, or changes secondary to artifacts.
OCT in Glaucoma Management
Limitations
|
Artifacts such as vitreous opacities obscuring the scan circle, media opacities reducing the signal strength, vitreopapillary traction and peripapillary atrophy (PPA) can alter the pRNFL thickness and possibly mimic glaucomatous thinning.46,49,50 Progression software is a good adjunct for eyes with diffuse RNFL defects or an unidentifiable RNFL status in which photographic assessment is not reliable.51 However, in patients with advanced glaucomatous optic neuropathy, OCT has limited benefit for identifying progressive optic nerve changes.34
A New View
OCT has proven to be a valuable diagnostic tool, and there is strong evidence for its applications for both retinal pathologies and optic neuropathies. For AMD, OCT can aid in the decision on whether further treatment is necessary. TD-OCT can aid in the initial diagnosis of neovascular AMD, although it should not replace the reference standard of FA yet. Further studies are needed to determine the role of SD-OCT. In DME, OCT can confirm macular edema, and decisions to treat are often based on its findings. However, OCT should not be used to screen diabetic patients with no or minimal retinopathy. Although considered complementary by the AAO PPP, OCT measurements of the pRNFL, ONH parameters and ganglion cell analysis have been shown to assist in the detection and progression of glaucoma. As newer technology such as swept-source OCT becomes available, it will play an increasing role in the management of glaucoma and other ocular conditions within clinical practice.Reimbursement for OCTFor billing purposes, OCT is considered a scanning computerized ophthalmic diagnostic imaging (SCODI) test. Anterior segment SCODI is recognized for the evaluation and treatment of diseases affecting the cornea, iris and other anterior chamber structures. The imaging can also provide additional information during planning and follow-up of anterior segment and cataract surgeries. Posterior segment SCODI can assist in the diagnosis and management of retinal and neuro-ophthalmic diseases. It is also used to follow glaucoma suspects, diagnose glaucoma, monitor glaucoma treatment and detect glaucoma progression. Limitations of coverage include the absence of an indication or for screening only.
The Medicare administrative contractor (MAC) found in each contractor’s local coverage determination has a comprehensive list of ICD-10 diagnosis codes that are used in conjunction with the CPT codes. The list of ICD-10 diagnoses is grouped into 92132 (anterior segment), 92133 (posterior segment-optic nerve), and 92134 (posterior segment-retina). The patient’s medical record must contain documentation that fully supports the medical necessity for the services. Insurance providers may have an annual frequency limitation for SCODI billing. In general, diagnostic tests are reimbursed when medically indicated, and clear documentation is necessary for justification. Policies commonly state that diagnosis codes can only be billed one or two times per year for 92133 (posterior segment-optic nerve) for glaucoma, but more often for retinal diseases (92134) such as AMD and DME. | ||||||||
Dr. Vien practices at the Veterans Affairs Palo Alto Healthcare System and is an assistant clinical professor at University of California Berkeley School of Optometry and Southern California College of Optometry at Marshall B. Ketchum University.
Dr. Yang practices at the Veterans Affairs Palo Alto Healthcare System and is an associate clinical professor at the University of California Berkeley School of Optometry.
|
1. Martin DF, Maguire MG, Fine SL, et al. Comparison of Age-related Macular Degeneration Treatments Trials (CATT) Research Group. Ranibizumab and bevacizumab for treatment of neovascular age-related macular degeneration: two-year results. Ophthalmology. 2012;119:1388-98. 2. Brown DM, Quan DN, Marcus DM, et al. RISE and RIDE Research Group. Long-term outcomes of ranibizumab therapy for diabetic macular edema: the 36-month results from two phase III trials. Ophthalmology. 2013;120(10):2013-22. 3. Kahn HA, Leibowitz HM, Ganley JP, et al. The Framingham Eye Study. Outline and major prevalence findings. Am J Epidemiol. 1977;106:17-32. 4. Ferris FL III, Fine SL, Hyman L. Age-related macular degeneration and blindness due to neovascular maculopathy. Arch Ophthalmol. 1984;102:1640-2. 5. American Academy of Ophthalmology Retina/Vitreous Panel. Preferred Practice Pattern Guidelines. Age-related macular degeneration. San Francisco, CA: American Academy of Ophthalmology; 2015. www.aao.org/ppp. 6. Ramussen A, Brandi S, Fuchs J, et al. Visual outcomes in relation to time to treatment in neovascular age-related macular degeneration. Acta Ophthalmol. 2015;93:616-20. 7. Treatment of Age-Related Macular Degeneration With Photodynamic Therapy Study. Photodynamic therapy of subfoveal choroidal neovascularization in age-related macular degeneration with verteporfin: one-year results of 2 randomized clinical trials–TAP Report 1. Arch Ophthalmol. 1999;117:1329-45. 8. Azab M, Boyer DS, Bressler NM, et al. Visudyne in Minimally Classic Choroidal Neovascularization Study Group. Verteporfin therapy of subfoveal minimally classic choroidal neovascularization in age-related macular degeneration: 2-year results of a randomized clinical trial. Arch Ophthalmol. 2005;123:448-57. 9. Rosenfeld PJ, Brown DM, Heier JS, et al. Ranibizumab for neovascular age-related macular degeneration. N Engl J Med. 206;335:1419-31. 10. Brown DM, Kaiser PK, Michels M, et al. ANCHOR Study Group. Ranibizumab versus verteporfin for neovascular age-related macular degeneration. N Engl J Med. 2006;355:1432-44. 11. Khurana RN, Dupas B, Bressler NM. Agreement of time-domain and spectral-domain optic coherence tomography with fluorescein leakage from choroidal neovascularization. Ophthalmology. 2010;117;1376-80. 12. Do DV, Gower EW, Cassard SD, et al. Detection of new-onset choroidal neovascularization using optical coherence tomography: the AMD DOC study. Ophthalmology. 2012;119:771-8. 13. Wilde C, Patel M, Lakshmanan A, et al. The diagnostic accuracy of spectral-domain optical coherence tomography for neovascular age-related macular degeneration: a comparison with fundus fluorescein angiography. Eye. 2015;29;602-9. 14. Castillo MM, Mowatt G, Lois N, et al. Optical coherence tomography for the diagnosis of neovascular age-related macular degeneration: a systemic review. Eye. 2014;28:1399-1406. 15. Castillo MM, Mowat G, Elders A, et al. Optical coherence tomography for the monitoring of neovascular age-related macular degeneration. Ophthalmology. 2015;122:399-406. 16. Hogg RE, Silva R, Staurenghi G, et al. Clinical characteristics of reticular pseudodrusen in the fellow eye of patients with unilateral neovascular age-related macular degeneration. Ophthalmology. 2014;121:1748-55. 17. Hariri A, Nittala MG, Sadd SR. Outer retinal tubulation as a predictor of the enlargement amount of geographic atrophy in age-related macular degeneration. Ophthalmology. 2015;122:407-13. 18. Lima LH, Laud K, Freund KB, et al. Acquired vitelliform lesion associated with large drusen. Retina. 2012;32:647-51. 19. Wu Z, Luu CD, Ayton LN, et al. Optical coherence tomography-defined changes preceding the development of drusen-associated atrophy in age-related macular degeneration. Ophthalmology. 2014;121:2415-22. 20. Early Treatment Diabetic Retinopathy Study Research Group. Photocoagulation for diabetic macular edema: Early Treatment Diabetic Retinopathy Study report number 1. Arch Ophthalmol. 1985;103:1796–806. 21. Nguyen QD, Brown DM, Marcus DM, et al. Ranibizumab for diabetic macular edema: results from 2 phase II randomized trials: RISE and RIDE. Ophthalmology. 2012;119:789-801. 22. Brown DM, Nguyen QD, Marcus DM, et al. Long-term outcomes of ranibizumab therapy for diabetic macular edema: the 36-month results from two phase III trials: RISE and RIDE. Ophthalmology. 2013;120:2013-22. 23. Elman MJ, Qin H, Aiello LP, et al. Diabetic Retinopathy Clinical Research Network. Intravitreal ranibizumab for diabetic macular edema with prompt versus deferred laser treatment: three-year randomized trial results. Ophthalmology. 2012;119:2312-8. 24. Do DV, Nguyen QD, Khwaja AA, et al. READ-2 Study Group. Ranibizumab for edema of the macula in diabetes study: 3-year outcomes and the need for prolonged frequent treatment. JAMA Ophthalmol. 2013;131:139-45. 25. American Academy of Ophthalmology Retina/Vitreous Panel. Preferred Practice Pattern Guidelines. Diabetic retinopathy. San Francisco, CA: American Academy of Ophthalmology; 2014. www.aao.org/ppp. 26. Pires I, Santos AR, Nunes S, et al. Subclinical macular edema as a predictor of progression to clinically significant macular edema in type 2 diabetes. Ophthalmologica. 2013;230:201-6. 27. Davis MD, Bressler SB, Aiello LP, et al. Comparison of time-domain OCT and fundus photographic assessments of retinal thickening in eyes with diabetic macular edema. Invest Ophthalmol Vis Sci. 2008;49:1745-52. 28. Virgili G, Menchini F, Casazza G, et al. Optical coherence tomography (OCT) for detection of macular oedema in patients with diabetic retinopathy. Cochrane Database Syst Rev. 2015 Jan;1:CD008081. 29. Browning DJ, Fraser CM. The predictive value of patient and eye characteristics on the course of subclinical diabetic macular edema. Am J Ophthalmol. 2008;145:149-54. 30. Bressler NM, Miller KM, Beck RW, et al. Observational study of subclinical diabetic macular edema. Eye. 2012;26:833-40. 31. Browning DJ. Diabetic retinopathy: evidenced-based management. New York, NY: Springer; 2010. 32. Kass MA, Heuer DK, Higginbotham EJ, et al. The ocular hypertension treatment study: a randomized trial determines that topical ocular hypotensive medication delays or prevents the onset of primary open angle glaucoma. Arch Ophthalmol. 2002;120:701-3. 33. Heijl A, Leske MC, Bengtsson B, et al. Reduction of intraocular pressure and glaucoma progression: results from the early manifest glaucoma trial. Arch Ophthalmol. 2002;120:1268-79. 34. American Academy of Ophthalmology Glaucoma Panel. Preferred Practice Pattern Guidelines. Primary open-angle glaucoma. San Francisco, CA: American Academy of Ophthalmology; 2014. www.aao.org/ppp. 35. Jonas JB, Budde WM, Panda-Jonas S. Ophthalmoscopic evaluation of the optic nerve head. Surv Ophthalmol. 1999;43:293-320. 36. Mills RP. Glaucoma imaging: technology in progress. J Glaucoma. 1999;8:87–9. 37. Mwanza JC, Oakley JD, Budenz DL, et al. Ability of cirrus HD-OCT optic nerve head parameters to discriminate normal from glaucomatous eyes. Ophthalmology. 2011;118:241-8. 38. Michelessi M, Lucenteforte E, Oddone F, et al. Optic nerve head and fibre layer imaging for diagnosing glaucoma. Cochrane Database Syst Rev. 2015;11:CD008803. 39. Gupta PK, Asrani S, Freedman SF, et al. Differentiating glaucomatous from non-glaucomatous optic nerve cupping by optical coherence tomography. Open Neurol J. 2011;5:1-7. 40. Pasol J. Neuro-ophthalmic disease and optical coherence tomography: glaucoma look-alikes. Curr Opin Ophthalmol. 2011;22:124-32. 41. Hood DC, Raza AS, de Moraes CG, et al. Glaucomatous damage of the macula. Prog Retin Eye Res. 2013;32:1-21. 42. Hood DC, Slobodnick A, Raza AS, et al. Early glaucoma involves both deep local, and shallow widespread, retinal nerve fiber damage of the macular region. Invest Ophthalmol Vis Sci. 2014;55:632-49. 43. Padhy D, Rao A. Macular ganglion cell/inner plexiform layer measurements by spectral domain optical coherence tomography for detection of early glaucoma and comparison to retinal nerve fiber layer measurements. Am J Ophthalmol. 2014;158:211. 44. Spaeth GL, Reddy SC. Imaging of the optic disc in caring for patients with glaucoma: ophthalmoscopy and photography remains the gold standard. Surv Ophthalmol. 2014;59:454-8. 45. Akashi A, Kanamori A, Ueda K, et al. The ability of SD-OCT to differentiate early glaucoma with high myopia from high myopic controls and nonhighly myopic controls. Invest Ophthalmol Vis Sci. 2015;56:6573-80. 46. Chong GT, Lee RK. Glaucoma versus red disease: imaging and glaucoma diagnosis. Curr Opin Ophthalmol. 2012;23:79-88. 47. Leung CK, Cheung CY, Weinreb RN, et al. Retinal nerve fiber layer imaging with spectral-domain optical coherence tomography: a variability and diagnostic performance study. Ophthalmology. 2009;116:1257–63. 48. Wu W, Boer JF, Chen TC. Reproducibility of retinal nerve fiber layer thickness measurements using spectral domain optical coherence tomography. J Glaucoma. 2011;20:470-6. 49. Liu Y, Simavil H, Que CJ, et al. Patient characteristics associated with artifacts in Spectralis optical coherence tomography imaging of the retinal nerve fiber layer in glaucoma. Am J Ophthalmol. 2015;159:565-76. 50. Asrani S, Essaid L, Alder BD, et al. Artifacts in spectral-domain optical coherence tomography measurements in glaucoma. JAMA Ophthalmol. 2014;132:396-402. 51. Lee JR, Sung KR, Na JH, et al. Discrepancy between optic disc and nerve fiber layer assessment and optical coherence tomography in detecting glaucomatous progression. Jpn J Ophthalmol. 2013;57(6):546–52. 52. Centers for Medicare and Medicaid Services. Local Coverage Determination: Scanning Computerized Ophthalmic Diagnostic Imaging. Accessed January 3, 2016. www.cms.gov/medicare-coverage-database/details/lcd-details.aspx?LCDId=34380. |

